Map and Geospatial Hub news

Dutton’s Atlas Project Featured on KJZZ Radio
The Dutton’s Atlas project was recently featured on KJZZ’s The Show radio program. KJZZ is the local National Public Radio (NPR) affiliate station for the greater Phoenix region. Listen to project d...

Map of the Month: December 2022
Our December Map of the Month is this 1970 map of Antarctica area stations that was prepared for the 1969 expedition of the U.S. Navy Operation Deep Freeze called “Deep Freeze 70”. It is a complete ma...

Map of the Month: November 2022
Our November Map of the Month is this 1919 British War Office map titled “Map of Africa to Illustrate the Progress of Surveys and Explorations”. Originally published in 1914 and updated in this editio...

ASU Library exhibit celebrates 140-year anniversary of Dutton's Atlas
Oh, people might have read John Wesley Powell’s 1875 book, ultimately titled “The Exploration of the Colorado River and Its Canyons,” but the book wasn’t so much a deep dive into the size, beauty and ...

Dutton's Atlas Symposium: Register Now
Join us for an engaging, entirely free and open-to-the-public symposium event offering insightful, thought-provoking presentations on the various historical-geographical and socio-cultural dimensions ...

Map of the Month: October 2022
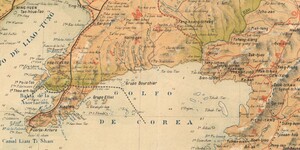
Our October Map of the Month is this undated Spanish map titled “Corea y Sur de Mandchuria” (Korea and South Manchuria). It depicts the Korean Peninsula and Southern Manchuria just prior to the start ...

Map of the Month: September 2022
Our September Map of the Month is this mid-1800s map exploring the feasibility of constructing a trans-continental railroad route through Arizona. The full title is “Explorations and Surveys for a Rai...

ASU Library to host 'Dutton's Atlas Symposium: How Cartography Helped the Grand Canyon become Grand'
Celebrate “Dutton’s Atlas,” a masterpiece of early geological inquiry into the Grand Canyon. The public is invited to attend a free symposium presented by the Map and Geospatial Hub at Hayden Library ...

Map of the Month: August 2022
Our August Map of the Month is this 1964 reproduction of a 1764 map titled “Plan de la Nouvelle Orleans”. It depicts the land that now makes up New Orleans' French Quarter as it existed over 250 years...