history news

Magnification of the map inset showing the borders of Central American states. In the map, Honduras, Verapaz, Chiapas, Guatemala, and Nicaragua are depicted with boundaries which have drastically evolved since 1846. Boundaries are represented by a dotted or dashed line. Solid lines in the interior of the peninsula reflect major drainages. Concentric lines surrounding the peninsula reflect the elevational descent into the Gulf of Mexico.

Map of the Month: July 2022

Our July Map of the Month is this 1848 “Mexico & Guatemala” map published just before the end of the Mexican-American War by S. Augustus Mitchell. It features a detailed depiction of the various international and state boundaries of Mexico and Central America at the time, many of which were alte...

A magnified view of the Durango and Rio Grande Railroad lines. The Durango rail is represented by a black line with white dots, while the Rio Grande is red with white dots. Major cities like Colorado Springs, Denver, and Durango are bold, while surrounding cities are smaller in size.

Map of the Month: June 2022

Our June Map of the Month is a 1905 “Map of the Denver & Rio Grande System” depicting the extent of the Denver and Rio Grande Railroad at the time as well as its connecting lines and variation in rail type throughout the system. The Denver and Rio Grande was one of the largest and most significa...

Historic map depicting Northern Mexico, Baja California, and parts of Arizona, New Mexico, Texas, and Louisiana Territory

Map of the Month: December 2021

Our December Map of the Month is this French map titled “New Mexico, with the Northern Part of Old, Or New Spain”. Among the oldest maps in our collection, this map was made by Rigobert Bonne and was published in 1780 as part of Guillaume-Thomas Raynal’s famous Atlas de Toutes Les Parties Connues du...

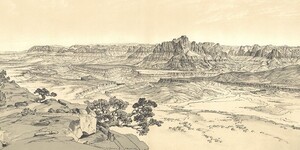
A hand-drawn view of the Grand Canyon from the Transept.

ASU News: How cartography helped the Grand Canyon become grand

View the full ASU News Article, How cartography helped the Grand Canyon become grand, written by Lauren Whitby, and published on September 28, 2021, at the following URL: https://news.asu.edu/20210928-arizona-impact-how-cartography-helped-grand-canyon-become-grand ...

An image of the current map of the month, a French map of the Colorado river from 1844.

Map of the Month: June 2021

Our June Map of the Month is this 1844 Plan de l'embouchure du Rio Colorado dans la Mer Vermeille (English title: Plan from the Mouth of Rio Colorado in the Ruddy Sea). It is a French survey of the mouth of the Colorado River that displays information on the river’s depth, islands, and other navigat...

Pilot Chart of the Great Lakes

Map of the Month – March 2021

Our March 2021 Map of the Month is this 1897 Pilot Chart of the Great Lakes by J.E. Craig and A.C. Roberts. It includes a detailed navigational map of the lakes as well as a variety of information on boating etiquette, weather signals, and other useful notes for sailing on the Great Lakes.   ...

A section of the map focusing on the central portion of the state. The county names, Maricopa, Gila, Graham, and Greenlee, are written in bold and are positioned in the center of their respective location. A bold red boundary outlines county-lines. Segments of the map, including the Fort Apache, White Mountain, Salt River, and Gila River indigenous reservations are outlined and filled with yellow. Counties colored with a green boundary represent national forests.

Map of the Month – February 2021

On February 14, 1912, the Territory of Arizona became a state at the end of one of the most complex journeys to statehood in American history. To celebrate Arizona’s statehood anniversary, February’s Map of the Month is titled State of Arizona and depicts Arizona in 1912, only a few months after it ...

In the top left corner is a black and white grid-style map of the city St. Petersburg. To the right and below the small map of St. Petersburg is a colored map showing the countries and their affiliations during the seat of war. Geographic locations represented in the image are separated by the Baltic Sea with a small portion of Sweden (blue) and the countries of Prussia (red), Belgium (blue), France (green), Austria (green), and the Russian Empire (yellow).

Map of the Month – January 2021

The Map and Geospatial Hub is excited to announce the beginning of our new Map of the Month series where we will highlight a unique map in our collection at the end of each month. Our first featured Map of the Month is a historic map of the Crimean War titled Seat of War, published in 1854 by G.S. W...

USGS Aerial Orthophoto Web Map Index

If you’re looking for aerial photographs of Arizona from the 1970’s, the USGS Orthophotos are a good place to start. The scale for these black and white photos is 1:24,000 and they line up with the USGS 7.5’ topographic map series. These photos are housed at the ASU Map and Geospatial Hub. While th...